
“What is the next item in the number sequence: 11, 8, 15, 12, 18, 28, 36, 20, 39?” asks Professor Péter Simon the seemingly simple question. In math classes, teachers compile similar sequences as a school assignment, and we have never imagined it would be of practical use to think about the rules of such number sequences.
“The sequence above involves the number of people infected in the current epidemic in Hungary on the first few days. Accordingly, the skill of understanding rules and correlations immediately gains more relevance,” says the professor and Head of the Department of Applied Analysis and Computational Mathematics at Eötvös Loránd University.
Let’s have a look at the following number sequences,
123, 172, 472, 970, 1424, 1535 – smartphone sales in millions of pieces every two years beginning with 2007,
623, 907, 1608, 3018, 4448, 6134 – the population of the Earth in millions of people every one hundred years beginning with 1700,
650, 150, 90, 54 – the amount of antibiotics in the blood in milligrams per hour after taking the medicine,
8550, 8640, 8740, 8730, 8750, 8770, 8780 – the price of OTP shares in HUF per hour on 16 March 2017.
It stands for any of the former sequences that many people would be willing to give a lot of money if someone could tell them the next few elements in advance.
“Based on our school memories, we tend to believe that simply by looking at the numbers in the sequence at length, we can interpret some mystical rule by which the following elements can be calculated,” says Péter Simon. Over the past few hundred years, however, mathematics has worked out more complex methods for finding the solutions.
The 17th century saw a breakthrough in the field of mathematical modelling of physical processes in Europe.
Surely, many have heard of Newton’s apple or Galileo’s experiment carried out in the Leaning Tower of Pisa. It was then that differential calculus and integral calculus were discovered (or rather, according to some, they were invented) primarily for the purpose of introducing differential equations to describe physical processes. These are equations where the unknown element is not a number but a function, such as the location of an object dropped from a tower versus time, or the orbit of the Earth around the Sun, to relate to the experiments of the two scientists above. The solution to the number sequences mentioned in the introduction lies in differential equations.
A model developed at the beginning of the twentieth century divides individuals into a few groups according to the state of infection. The simplest model distinguishes the following three groups:
- suspectible (S),
- infectious (I),
- recovered or removed (R).
Before the breakout of an epidemic, all individuals are susceptible, and the epidemic begins with the appearance of a few infectious individuals. The question is the number of the infectious individuals at a later date. This is when differential equation comes into the picture. It models the process, that is, shows the relationship between the changes of S, I, and R, as well as their current values.
The figure below displays the data of the 2016 influenza epidemic in Hungary (with red circles) and the (approximate) curve obtained from the model. The horizontal axis shows the time in days from the outbreak of the epidemic in January, while the vertical axis shows the number of infectious people per 100,000 population. (Therefore, in the total population of Hungary, this number is one hundred times higher). Although a vaccine against the influenza epidemic already exists and there is rarely need for an intensive care as in the case of the COVID-19 pandemic, the fundamental regularities of the spread are similar in both cases.
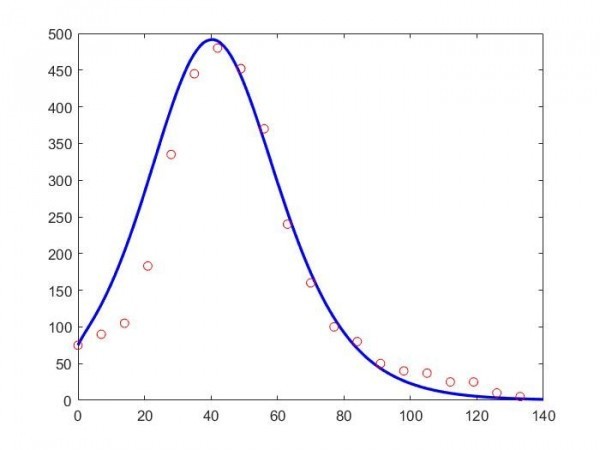
The model provides a relatively good approximation of the process of the epidemics, but it is visible that it cannot reflect all the data accurately. It can be observed that the number of infectious people rises for a while, then it begins to decrease, and the epidemic is over in about twenty weeks. By indicating the value of R, we can also see how many people went through the disease during the whole period of the epidemic. For this, we get roughly eighteen thousand here per 100,000 population. In other words, more or less one-sixth of the population suffered from the flu that year.
The model above indicates higher infection rates in the first weeks than it is shown by the data. Differently speaking, if someone wanted to determine the parameters of the model based on data from the first few weeks, they would predict a less severe epidemic. This has motivated epidemiologists and mathematicians to make a more accurate model. More precise models usually split society into several groups. For example, they create age groups within categories S, I, and R, or they divide the entire population into smaller parts by area.
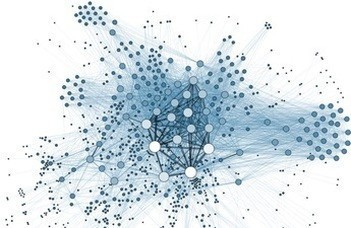
These models already involve several equations – that is how they can make a more correct prediction –, but because of this, they also comprise more parameters that are not easy to determine precisely from the data. The most detailed model treats each member of the society separately and in some way it also takes into account the relationships among people, hence its alterative name network model, which is based on the modern toolkit of network science.
Numerous variations have already been made to model the current epidemic. Many scholars have attempted to predict its course in many different ways and thus help policymakers. Until vaccination is available, the strategy of epidemic control depends on the so-called “flattening of the epidemic curve”. The objective is therefore to keep the maximum of the curve above, below a value that would put too much pressure on the healthcare system.
The curve can be influenced by modifying the parameters in the model.
One of the important parameters indicates how many other people are infected by one infectious person, and this is what the authorities are trying to reduce by introducing restrictions. Of course, this is not the only parameter in complex models, as the parameters may differ by age group and area, and even by places of work.
The current investigations are focused on how accurately these models correspond to the data, how they can be utilized to control the process, and which constraints are the most effective ones according to them. Furthermore, once the vaccine is available, they will also help us decide in what order the different age groups of the society should be vaccinated so that life can get back to normal as quickly as possible. These are seemingly simple questions, but the creation and analysis of increasingly complex models poses a real challenge for many researchers.

Megjegyzések0
Nincs jogosultsága a megtekintéshez, illetve megjegyzés írásához.Kérjük, jelentkezzen be.
Javasolt cikkek